整理资料时,发现几年前的整理的问题问题排查手册,分享下。
生产问题处理的基本原则:
-
第一时间恢复业务(重点)
-
重启解决不了的问题,能回滚就回滚
-
如果业务不可逆,才是找问题的解决的时候(一旦到了这里,说明,大版本改动,没有做Bplan)
-
恢复业务后再去分析问题
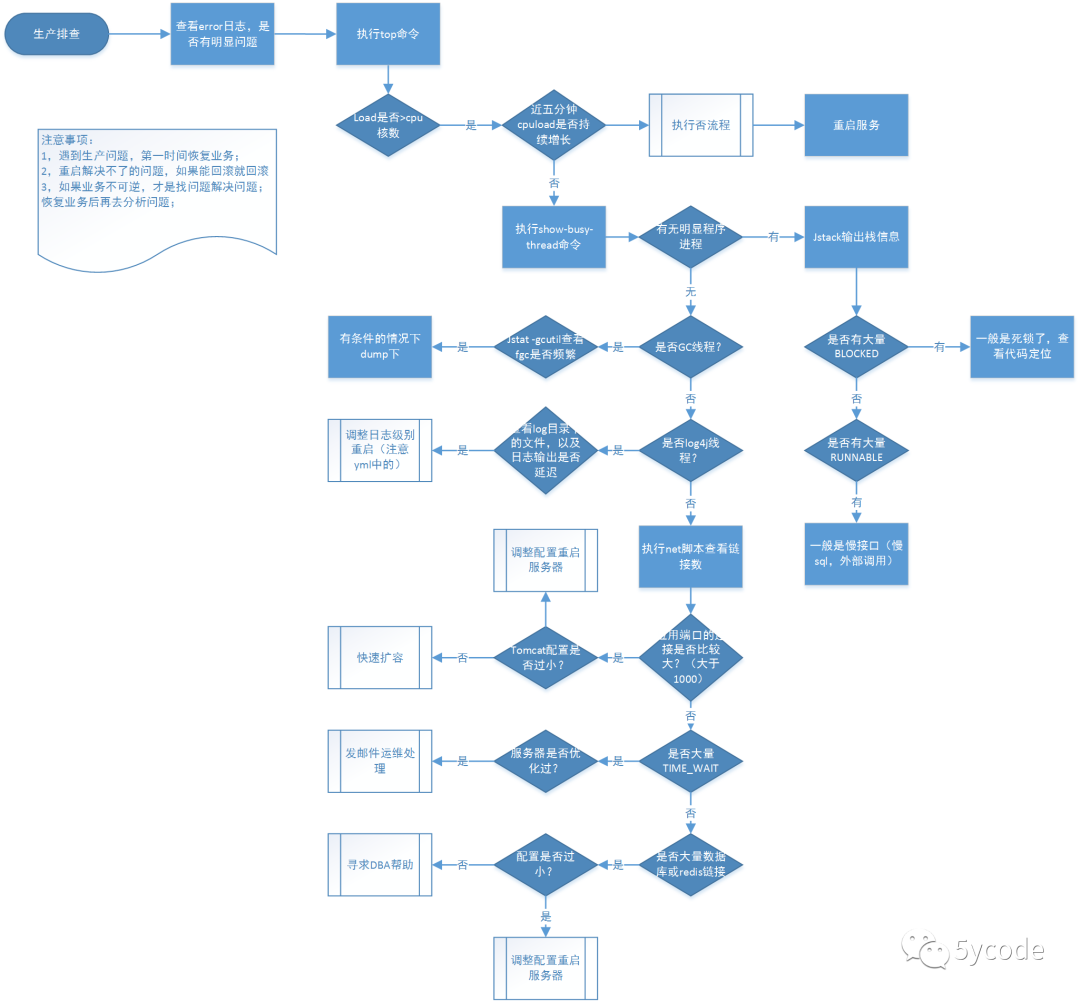
执行top命令
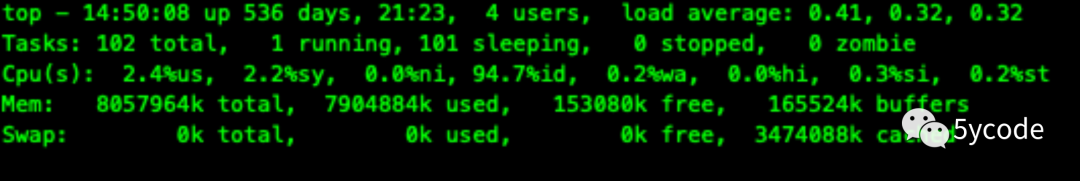
重点查看 load averag 设 A(0.41近5分钟)B(0.32 近10分钟)C(0.32 近15分钟)
-
如:0.41 代表近5分钟的load值,第一个0.32 代表近10分钟的load值,第二个0.32代表近15分钟的load值;
-
假设cpu的核数为4,当load 大于4的时候cpu已经100%报警了;
-
如果:A>B>C 且A逐步变大,代表cpu的load值在持续上升,这个时候只能重启(先保留现场)
-
如果:A<B<C 且A逐步变小,代表cpu的load值在逐步恢复,可以观察一下;
执行sh show-busy-java-threads.sh 找到最耗cpu的线程
https://github.com/oldratlee/useful-scripts/blob/master/show-busy-java-threads
-
如果前几个都是gc的进程且比较高,代表着程序在频繁的fullgc;对象未释放(锁、事务等),或者出现了大对象;
-
如果前几个都是log4j的进程且比较高,代表着日志输出积压,这个时候看下log输出,一般log日志中都已经延迟好久
-
如果前几个是tomcat相关的进行,表示连接打满,新的请求过来,一直在获取链接(高并发或者程序有慢接口)
-
如果前几个是其他的业务进行,则需要进行分析;
示例:
show-busy-java-threads  -p  1111  #  获取进程1111最耗费cpu的5个线程
show-busy-java-threads 1  10   # 每隔一秒执行一次,共计执行10次
show-busy-java-threads -a 1.log  # 将结果输出到1.log文件中
show-busy-java-threads  -S ~/test/ # 将jstack输出到当前用户的test目录下
sh show-busy-java-threads.sh  1 10  -S ~/test1/ -a 2.log

 综合
# 从所有运行的Java进程中找出最消耗CPU的线程(缺省5个),打印出其线程栈
# 缺省会自动从所有的Java进程中找出最消耗CPU的线程,这样用更方便
# 当然你可以手动指定要分析的Java进程Id,以保证只会显示你关心的那个Java进程的信息
show-busy-java-threads -p <指定的Java进程Id>
show-busy-java-threads -c <要显示的线程栈数>
# 多次执行;这2个参数的使用方式类似vmstat命令
show-busy-java-threads <重复执行的间隔秒数> [<重复执行的次数>]
# 记录到文件以方便回溯查看
show-busy-java-threads -a <运行输出的记录到的文件>
# 指定jstack输出文件的存储目录,方便记录以后续分析
show-busy-java-threads -S <存储jstack输出文件的目录>
执行net.sh 脚本
#当前服务的端口(过高代表外部请求的链接过多)
echo “9016 端口连接数:” `netstat -nat|grep -i "9016"|wc -l`
#当前数据库的端口的链接总数(过高表示可能有慢sql或者,注意多数据源)
echo “3306端口连接数:” `netstat -nat|grep -i "3306"|wc -l`
#当前redis的链接总数(过高表示redis的链接数过高,注意多数据源)
echo “6379端口连接数:” `netstat -nat|grep -i "6379"|wc -l`
# 查看tcp链接状态以及对应的状态(如果TIME_WAIT>ESTABLISHED则需要调整服务器参数)
echo "TCP 链接状态及数量:" `netstat -n | awk '/^tcp/ {++S[$NF]} END {for(a in S) print a,S[a]}'`
# 查看tcp链接TIME_WAIT对应的个数和ip
echo `netstat -natp|grep TIME_WAIT|awk '{print $5}'|awk -F ":" '{print $1}'|sort -n|uniq -c|sort -nr`
栈信息打印 jstack
可以看下https://alibaba.github.io/arthas/install-detail.html
jstack  pid >pid.log
如:jstack 7040 > 7040.log
# 统计出栈中不同的线程状态在
awk  -F: '/java.lang.Thread.State:/ {++S[$2]} END {for(a in S) print a,S[a]}'   7040.log

如果BLOCKED过多,则表示程序中有死锁的代码,建议直接在文件中搜索BLOCKED 字段,定位对应的代码
如果 RUNNABLE过多,看下是否是同一个类,如果是,则表示慢接口或队列一直在处理(如日志输出)
  public enum State {
        /**
         * Thread state for a thread which has not yet started.
         * 创建,但没启动
         */
        NEW,

        /**
         * Thread state for a runnable thread.  A thread in the runnable
         * state is executing in the Java virtual machine but it may
         * be waiting for other resources from the operating system
         * such as processor.
         * 正在运行
         */
        RUNNABLE,

        /**
         * Thread state for a thread blocked waiting for a monitor lock.
         * A thread in the blocked state is waiting for a monitor lock
         * to enter a synchronized block/method or
         * reenter a synchronized block/method after calling
         * {@link Object#wait() Object.wait}.
         * 阻塞,正在等待锁(临界资源)如:进入synchroinzed block方法或者重进入synchronize block方法,
         * 注:java是支持重入reentrant 的。
         */
        BLOCKED,

        /**
         * Thread state for a waiting thread.
         * A thread is in the waiting state due to calling one of the
         * following methods:
         * 等待,无限等待另一个线程执行一个特定动作,常见的如下:
         * <ul>
         *   <li>{@link Object#wait() Object.wait} 没有设置等待时间</li>
         *   <li>{@link #join() Thread.join} 没有设置等待时间</li>
         *   <li>{@link LockSupport#park() LockSupport.park} 没有设置等待时间</li>
         * </ul>
         *
         * <p>A thread in the waiting state is waiting for another thread to
         * perform a particular action.
         *
         * For example, a thread that has called {@code Object.wait()}
         * on an object is waiting for another thread to call
         * {@code Object.notify()} or {@code Object.notifyAll()} on
         * that object. A thread that has called {@code Thread.join()}
         * is waiting for a specified thread to terminate.
         */
        WAITING,

        /**
         * Thread state for a waiting thread with a specified waiting time.
         * A thread is in the timed waiting state due to calling one of
         * the following methods with a specified positive waiting time:
         * 定时等待,等待另一个线程执行,并设置了一个具体的等待时间(超时)
         * <ul>
         *   <li>{@link #sleep Thread.sleep}</li>
         *   <li>{@link Object#wait(long) Object.wait} with timeout</li>
         *   <li>{@link #join(long) Thread.join} with timeout</li>
         *   <li>{@link LockSupport#parkNanos LockSupport.parkNanos}</li>
         *   <li>{@link LockSupport#parkUntil LockSupport.parkUntil}</li>
         * </ul>
         */
        TIMED_WAITING,

        /**
         * Thread state for a terminated thread.
         * The thread has completed execution.
         * 终止,线程已经退出执行时。
         */
        TERMINATED;
    }
gc信息查看
Jstat -gcutil pid 1000
# 7040表示进程id,1000表示多久输出一次
Jstat -gcutil 7040 1000
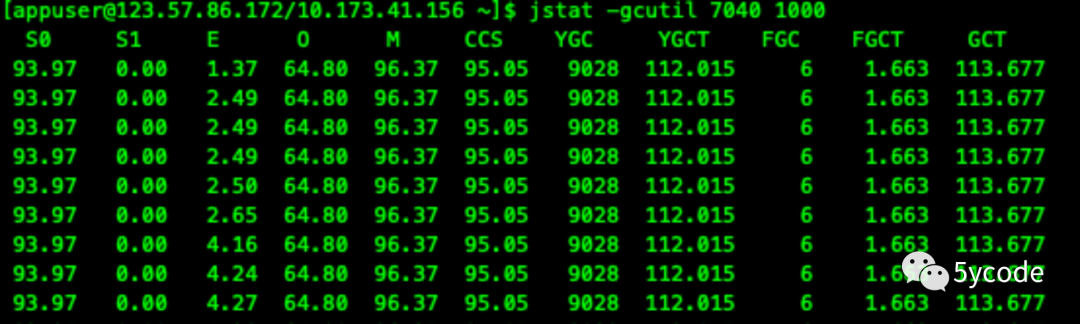
如果O达到了100%,且FGC快速变化,则表示频繁fullgc,每一次FGC都会stw;
dump堆信息
先jmap可以查看到具体的命令示例
jmap -heap pid
Example: jmap -dump:live,format=b,file=heap.bin <pid>

jmap -dump:live,format=b,file=7040.bin  7040  #输出堆文件用于线下分析(如果cpu过高不建议输出,会stw)
Jmap -heap 7040 输出当前的堆信息

附录:
解决TIME_WAIT
vim /etc/sysctl.conf
#添加以下内容
net.ipv4.tcp_syncookies = 1
net.ipv4.tcp_tw_reuse = 1
net.ipv4.tcp_tw_recycle = 1
net.ipv4.tcp_fin_timeout = 10
net.ipv4.tcp_keepalive_time = 1200
net.ipv4.ip_local_port_range = 2000 65500
net.ipv4.tcp_max_syn_backlog = 20480
net.ipv4.tcp_max_tw_buckets = 62000
net.core.somaxconn = 10240
vm.overcommit_memory=1
vm.swappiness = 1

/sbin/sysctl -p 让修改生效
解决本地线程不够的问题:
vim /etc/security/limits.d/90-nproc.conf        调整appuser线程数
appuser  soft nproc 10240
appuser  hard nproc 10240
通过 ulimit -a 查询当前用户的配置(max user processes)

文章评论